Discover the fundamentals of mean reversion in Forex, from statistical concepts to key indicators, strategies, and risk management techniques to enhance trading success.
Master the art of Mean Reversion with this comprehensive guide designed to elevate your Forex trading skills. Learn everything from the basic concepts to advanced strategies and practical applications that can transform your approach to trading.
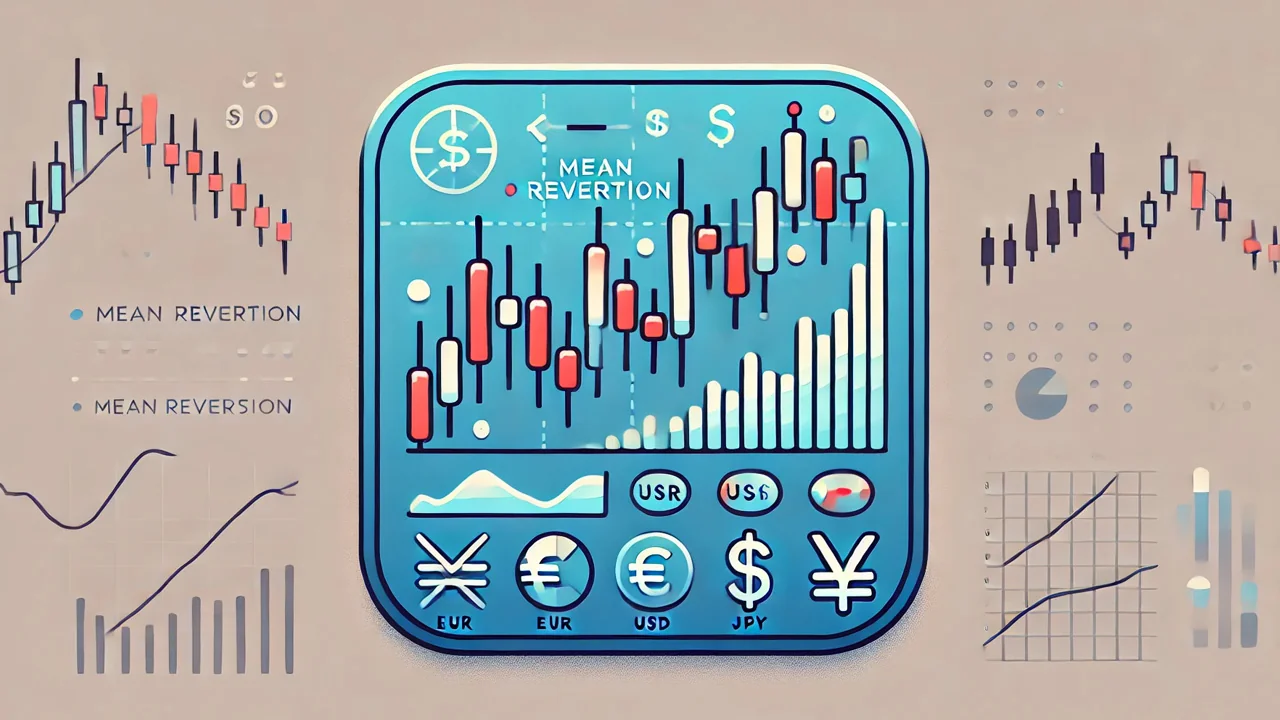
1. Introduction to Mean Reversion in Forex Trading
Mean Reversion is a highly popular trading strategy that has been adopted by many Forex traders worldwide. The core principle behind this strategy is the assumption that prices tend to revert to their mean or average value over time. This idea isn't limited to Forex but is used across various financial markets, including stocks, commodities, and even cryptocurrencies.
The appeal of Mean Reversion lies in its simplicity and effectiveness in certain market conditions. When prices move too far from their historical average, mean reversion traders expect a correction, allowing them to enter trades that capitalize on this anticipated movement. For example, if a currency pair experiences a sudden spike or dip due to unexpected news, mean reversion traders may look for opportunities to trade in the opposite direction, anticipating that the price will return to its mean.
Understanding the intricacies of this strategy, however, requires more than just knowing the basics. It is crucial to understand the statistical foundations that underpin mean reversion, as well as the key indicators and techniques used to implement this strategy effectively. Additionally, traders must be aware of the risks and challenges associated with mean reversion trading and know how to manage them.
2. Understanding the Statistical Basis of Mean Reversion
To grasp the concept of Mean Reversion fully, it is essential to understand the statistical principles that support it. The strategy relies on concepts such as the mean, standard deviation, and probability distributions. These mathematical tools help traders determine when a currency pair's price has deviated significantly from its historical average and is likely to revert.
Mean and Standard Deviation Explained
The mean is a simple arithmetic average, calculated by summing all the values in a data set and dividing by the number of observations. In Forex trading, the mean often refers to the average price of a currency pair over a specified period. When prices move far from this mean, it signals potential trading opportunities for mean reversion traders.
The standard deviation is a measure of how spread out the values in a data set are. It quantifies the degree of variation or dispersion from the mean. A high standard deviation indicates that prices are highly volatile and spread out, while a low standard deviation suggests that prices are more stable and clustered around the mean. Understanding standard deviation is crucial for assessing the likelihood of a price reversion. A price move that is two or three standard deviations away from the mean is considered statistically significant and may indicate a high probability of mean reversion.
Probability Distributions and Mean Reversion
Probability distributions play a significant role in mean reversion trading. The most common distribution used is the normal distribution, which describes how data points are spread around the mean. In a normal distribution, most values fall within one or two standard deviations of the mean, with fewer values occurring at the extremes. This statistical concept forms the basis for identifying when a price is overextended and likely to revert.
Traders should be aware that not all price movements follow a normal distribution. Market conditions, economic events, and changes in volatility can cause deviations from the expected pattern. As a result, it is important to use additional analysis and filters to confirm potential mean reversion trades.
3. Key Indicators for Mean Reversion Strategies
Several technical indicators can help traders identify mean reversion opportunities. These indicators are designed to highlight overbought and oversold conditions, making it easier for traders to determine when a currency pair is likely to revert to its mean. Let’s explore some of the most effective indicators used in mean reversion trading:
Bollinger Bands
Bollinger Bands are one of the most widely used tools in mean reversion trading. Developed by John Bollinger, these bands consist of a simple moving average and two bands set at a certain number of standard deviations above and below the moving average. The bands expand and contract based on market volatility. When the price touches the upper band, it indicates overbought conditions, while touching the lower band suggests oversold conditions.
For example, if the price of the EUR/USD pair touches the upper Bollinger Band, a mean reversion trader might consider entering a short position, expecting the price to revert to the mean. Conversely, if the price touches the lower band, the trader may look for a long position, anticipating a bounce back to the average.
Bollinger Bands are particularly useful because they adapt to market conditions. In periods of high volatility, the bands widen, while in periods of low volatility, they narrow. This adaptability makes them a versatile tool for identifying mean reversion opportunities.
Relative Strength Index (RSI)
The Relative Strength Index (RSI) is a momentum oscillator that measures the speed and change of price movements. It ranges from 0 to 100, with readings above 70 indicating overbought conditions and readings below 30 indicating oversold conditions. Mean reversion traders use the RSI to identify when a currency pair is likely to reverse its current trend.
For instance, if the RSI of the USD/JPY pair rises above 70, it may signal that the pair is overbought and due for a correction. Similarly, if the RSI drops below 30, it could indicate that the pair is oversold and likely to revert to the mean. The RSI is particularly effective when used in conjunction with other indicators, such as Bollinger Bands, to confirm trading signals.
Moving Averages
Moving averages are another essential tool for mean reversion traders. They smooth out price data to create a clearer picture of the overall trend. The two most common types of moving averages are the Simple Moving Average (SMA) and the Exponential Moving Average (EMA). The SMA calculates the average price over a specified period, while the EMA gives more weight to recent prices, making it more responsive to current market conditions.
Mean reversion traders often use moving averages to identify when the price has deviated significantly from its average. For example, if the price of the GBP/USD pair moves far above its 50-day SMA, it may be a sign that the price is overextended and due for a correction. Conversely, if the price drops significantly below the moving average, it may present a buying opportunity.
Mean Reversion Channels
Mean Reversion Channels are custom-built tools that use support and resistance levels to define the upper and lower bounds of a currency pair's typical price range. These channels help traders visualize when a currency pair has moved too far from its average price and is likely to revert. Setting up mean reversion channels can be done using various methods, such as regression analysis or applying standard deviation bands around a moving average.
These channels are especially helpful for traders who prefer a more visual approach to analyzing price behavior. They can be used to identify high-probability trade setups and make more informed decisions.
4. Developing a Mean Reversion Trading Strategy
Developing a successful mean reversion trading strategy requires careful planning and a deep understanding of the market. Here is a comprehensive guide to help you create a strategy that works for you:
Step-by-Step Guide to Creating a Strategy
- Identify Currency Pairs: Start by selecting currency pairs that are suitable for mean reversion trading. Pairs with high liquidity, such as EUR/USD, GBP/USD, and USD/JPY, often exhibit mean reversion behavior. These pairs are less susceptible to erratic price movements, making them ideal candidates for this strategy.
- Choose Appropriate Indicators: Use indicators that help identify overbought and oversold conditions. Bollinger Bands, RSI, and moving averages are commonly used in mean reversion strategies. Experiment with different combinations of indicators to see what works best for your trading style.
- Set Entry and Exit Rules: Define clear criteria for entering and exiting trades. For example, enter a long position when the price touches the lower Bollinger Band and the RSI is below 30, and exit when the price reverts to the mean. Similarly, set rules for short positions when the price touches the upper band and the RSI is above 70.
- Determine Time Frames: Choose time frames that align with your trading goals. Shorter time frames, such as 5-minute or 15-minute charts, are suitable for day traders, while longer time frames, like daily or weekly charts, are better for swing traders. The choice of time frame affects the frequency of trading opportunities and the amount of risk you take on each trade.
- Implement Risk Management: Develop a risk management plan that includes stop losses, take profits, and position sizing. A good rule of thumb is to risk no more than 1-2% of your trading capital on a single trade. This ensures that a losing trade does not have a significant impact on your overall account balance.
Choosing the Right Time Frames
Time frames play a crucial role in the success of a mean reversion strategy. Short-term traders may prefer lower time frames, such as 1-minute or 5-minute charts, to capture quick price reversals. However, these time frames require constant monitoring and can be more stressful due to the fast-paced nature of trading.
Swing traders, on the other hand, may use higher time frames, such as 4-hour or daily charts. These time frames allow for more relaxed trading, as price movements take longer to develop. The key is to choose a time frame that suits your lifestyle and risk tolerance. Some traders even use a multi-timeframe approach, analyzing longer time frames to identify the overall trend and using shorter time frames to fine-tune their entries and exits.
Defining Entry and Exit Points
Defining entry and exit points is one of the most critical aspects of a mean reversion strategy. Your entry criteria should be based on objective signals to minimize emotional decision-making. For example, if you are using Bollinger Bands, you might enter a trade when the price touches the outer band and the RSI confirms overbought or oversold conditions.
Exit points can be determined using several methods. One common approach is to set a take profit level at the mean or moving average. This ensures that you capture profits when the price reverts to the average. Alternatively, you can use a trailing stop to lock in profits as the price moves in your favor. The key is to have a clear exit plan to avoid holding on to trades for too long, which could lead to missed opportunities or increased risk.
5. Risk Management in Mean Reversion Trading
Risk management is a fundamental component of any trading strategy, and mean reversion is no exception. Without proper risk management, even the best strategy can lead to significant losses. Here are some key risk management techniques to consider:
Setting Stop Losses and Take Profits
Stop losses are essential for protecting your capital. They ensure that a single trade does not wipe out a significant portion of your account. When placing a stop loss, consider the volatility of the currency pair and the distance from the mean. A well-placed stop loss allows for natural price fluctuations while limiting potential losses.
Take profit levels should also be predefined. Many mean reversion traders set their take profit levels near the mean or slightly beyond it to maximize returns. This approach ensures that you lock in profits before the market moves against you. Alternatively, you can use a trailing stop to capture additional gains if the price continues to move in your favor.
Managing Leverage
Leverage is a double-edged sword in Forex trading. While it can amplify your profits, it can also magnify your losses. Mean reversion traders should use leverage cautiously and ensure it aligns with their risk tolerance. A conservative approach to leverage can help protect your trading capital and reduce the impact of losing trades.
For example, if your strategy has a high win rate but small profit margins, using excessive leverage could lead to a large drawdown if you experience a losing streak. On the other hand, if your strategy has a lower win rate but larger profit margins, you may be able to use more leverage. The key is to find a balance that works for your trading style and risk appetite.
Avoiding Overtrading and Emotional Decision-Making
One of the biggest challenges in trading is managing your emotions. Overtrading and making impulsive decisions can lead to unnecessary losses. To avoid this, stick to your trading plan and only take high-probability setups. If you find yourself feeling anxious or stressed, take a break and reassess your strategy.
Another way to manage your emotions is to use a trading journal. Keeping a record of your trades, including the reasons for entering and exiting, can help you identify patterns and improve your decision-making over time. Reviewing your journal regularly can also help you stay disciplined and focused on your long-term goals.
6. Backtesting and Optimizing Mean Reversion Strategies
Backtesting is a crucial step in developing a successful mean reversion strategy. It allows you to test your strategy using historical data to see how it would have performed under different market conditions. This process can help you identify strengths and weaknesses in your approach and make necessary adjustments before trading with real money.
The Importance of Backtesting
Backtesting provides valuable insights into the potential profitability and risk of your strategy. By analyzing historical data, you can see how your strategy would have performed over time and determine if it has a positive expectancy. A strategy with a positive expectancy is one where the average gain is greater than the average loss, resulting in overall profitability.
However, it is important to remember that past performance is not always indicative of future results. Market conditions change, and a strategy that worked well in the past may not perform as expected in the future. This is why continuous monitoring and optimization are necessary.
Tools and Software for Backtesting
Several tools and platforms are available for backtesting Forex strategies. Popular trading platforms like MetaTrader 4 (MT4) and TradingView offer built-in backtesting features that allow you to simulate trades based on historical data. For more advanced analysis, traders can use programming languages like Python or R to create custom backtesting scripts.
When backtesting, make sure to use a large enough data set to get reliable results. Testing your strategy over different market conditions, such as periods of high and low volatility, can help you understand how it performs in various environments. Additionally, consider using a forward-testing approach, where you test your strategy on live market conditions using a demo account to validate its effectiveness.
Analyzing Backtest Results
After completing your backtest, analyze the results to determine the strengths and weaknesses of your strategy. Key metrics to consider include the win rate, average profit per trade, maximum drawdown, and profit factor. These metrics can help you understand the risk and reward profile of your strategy and identify areas for improvement.
If your backtest reveals that your strategy has a high drawdown or low win rate, consider adjusting your entry and exit rules or adding additional filters to improve performance. Remember to test any changes thoroughly before implementing them in live trading.
7. Common Challenges in Mean Reversion Trading
While mean reversion strategies can be profitable, they are not without challenges. Understanding these challenges and knowing how to address them is crucial for long-term success.
Adapting to Market Conditions
Mean reversion strategies work best in ranging markets where prices oscillate around a central mean. However, in strongly trending markets, prices may not revert to the mean for an extended period, leading to significant losses. Identifying the current market condition is essential for determining whether a mean reversion strategy is appropriate.
To adapt to changing market conditions, consider using additional indicators or filters to identify trends. For example, you can use a trend-following indicator like the Moving Average Convergence Divergence (MACD) to determine if the market is trending or ranging.
Dealing with Extended Trends
Extended trends can be challenging for mean reversion traders, as prices may continue to move away from the mean without reverting. In such cases, it is important to have a solid risk management plan in place. Using stop losses and limiting the size of your trades can help you manage risk and avoid significant losses.
Another approach is to use a dynamic strategy that incorporates both mean reversion and trend-following elements. This can help you capture profits in trending markets while still taking advantage of mean reversion opportunities when they arise.
Handling Slippage and Execution Issues
Slippage occurs when the price at which your trade is executed differs from the price you expected. This can happen during periods of high volatility or when trading illiquid currency pairs. To minimize slippage, consider trading major currency pairs with high liquidity and using limit orders instead of market orders.
Execution issues, such as delays in placing or closing trades, can also affect your strategy's performance. Trading with a reliable broker and using a fast and stable internet connection can help reduce the impact of these issues.
8. Case Studies and Practical Examples
Studying real-life examples of mean reversion trades can provide valuable insights into how the strategy works in practice. Here are some case studies to illustrate the concepts discussed in this guide:
Example 1: Mean Reversion in EUR/USD
In this example, we analyze a mean reversion setup in the EUR/USD pair. The price had been trending upward and reached the upper Bollinger Band, signaling overbought conditions. At the same time, the RSI was above 70, further confirming that the pair was overbought.
The trader entered a short position, anticipating that the price would revert to the mean. A stop loss was placed just above the recent high, and a take profit level was set near the moving average. Over the next few hours, the price corrected and moved back toward the mean, resulting in a profitable trade.
Lessons Learned
This case study highlights the importance of using multiple indicators to confirm trading signals. The combination of Bollinger Bands and RSI provided a high-probability setup, while proper risk management ensured that the trade was executed safely.
Example 2: USD/JPY Mean Reversion Failure
Not all mean reversion trades are successful. In this example, the USD/JPY pair was in a strong downtrend when the price touched the lower Bollinger Band. The RSI indicated oversold conditions, and the trader entered a long position, expecting the price to revert to the mean.
However, the downtrend continued, and the price moved further away from the mean. The trade hit the stop loss, resulting in a loss. This case demonstrates the risk of trading mean reversion in trending markets and the importance of considering the broader market context.
Adjustments for Future Trades
To improve the strategy, the trader could use a trend indicator to filter out trades during strong trends. Additionally, waiting for a reversal candlestick pattern before entering a trade could help reduce the likelihood of losses in trending markets.
9. Advanced Concepts in Mean Reversion
Once you have mastered the basics of mean reversion trading, consider exploring advanced concepts to refine your strategy and improve your results. Here are some techniques to take your trading to the next level:
Multi-Timeframe Analysis
Multi-timeframe analysis involves examining the same currency pair on different time frames to get a more comprehensive view of the market. For example, if you are trading mean reversion on a 1-hour chart, consider looking at the daily chart to identify the overall trend. If the daily chart shows a strong trend, you may want to avoid mean reversion trades on the lower time frame.
Using multiple time frames can help you filter out low-probability trades and increase your chances of success. It also allows you to identify key support and resistance levels that may influence price behavior on your chosen time frame.
Combining Mean Reversion with Other Strategies
Combining mean reversion with other trading strategies can create a more robust approach. For example, you can use a trend-following strategy to trade in the direction of the overall trend and a mean reversion strategy to capture short-term corrections. This approach allows you to profit from both trending and ranging markets.
Another combination is to use mean reversion alongside breakout strategies. If a currency pair has been ranging for an extended period, a breakout strategy can help you capture the initial move, while a mean reversion strategy can be used to trade pullbacks.
Machine Learning and Quantitative Techniques
Advanced traders and quantitative analysts use machine learning algorithms to identify patterns in historical data and optimize their mean reversion strategies. Techniques such as regression analysis, support vector machines, and neural networks can be used to develop predictive models.
While machine learning requires a solid understanding of programming and data science, it can be a powerful tool for traders looking to gain a competitive edge. Python and R are popular programming languages for implementing these techniques, and there are numerous libraries and resources available to help you get started.
10. Conclusion and Final Thoughts
Mean reversion strategies can be highly effective in the Forex market if executed correctly. By understanding the statistical basis of mean reversion, using the right indicators, and developing a well-defined trading plan, you can increase your chances of success.
Remember that risk management is crucial, as even the best strategies can experience losses. Using stop losses, managing leverage, and avoiding overtrading are essential practices for long-term profitability.
Continuous learning and adaptation are also important. Markets change over time, and strategies that work well today may not be as effective in the future. By staying informed and being willing to adjust your approach, you can remain a successful trader in the ever-evolving Forex market.
We hope this guide has provided you with valuable insights into mean reversion trading. Happy trading, and may your strategies lead to consistent profits!
Published by:
![]() Daniel Carter
Daniel Carter